Blog
Blog What 500+ Companies and $3.4 Trillion in Spend Reveal About Supplier Inclusion in 2026
Many supplier programs seem to have gone quieter in public, but the numbers say they haven’t slowed down. Here’s what we learned from the Supplier Inclusion Benchmarks webinar, with Audrey Thomas and Carmen Bandy.

What’s the biggest worry for practitioners driving supplier inclusion programs going into 2027? We asked a live audience during our recent benchmarking webinar, and the answer might surprise you.
Finding certified suppliers in the right categories topped the list at 32%, ahead of proving ROI (27%) and getting leadership buy-in (23%). Trusting the numbers themselves, whether that’s reporting spend or the data behind it, barely cracked double digits.
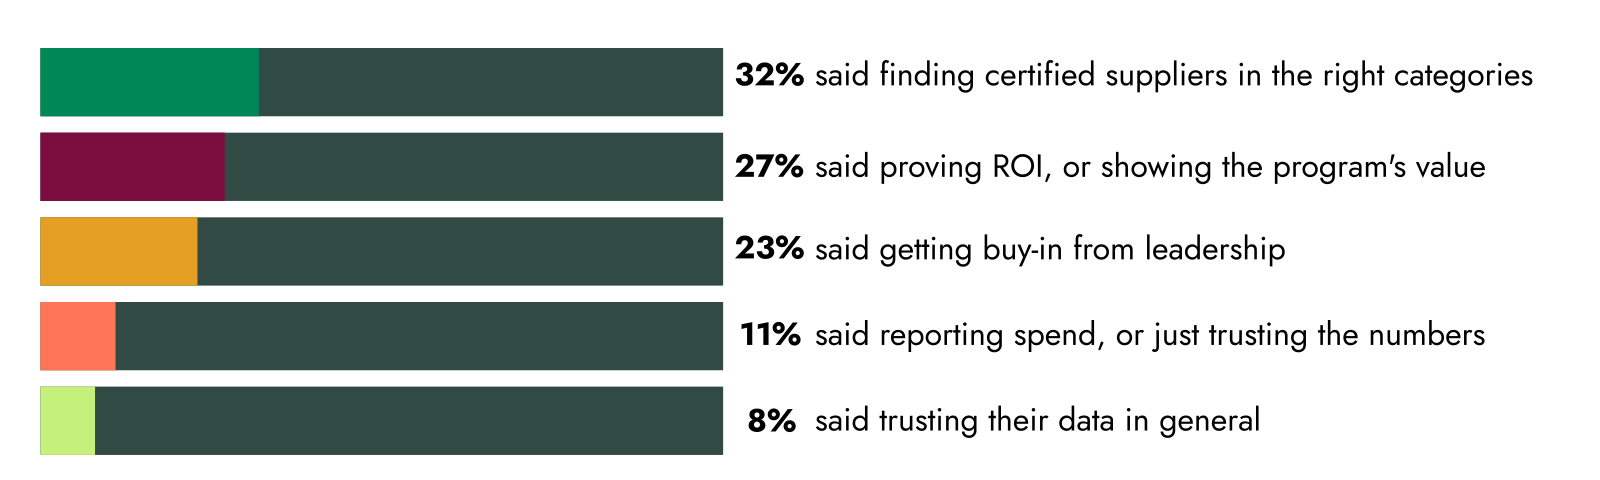
Sourcing beat budget worries and politics. That’s the gap this webinar set out to explain: what practitioners feel day to day versus what the data shows, and how benchmarking turns a feeling into a number you can act on.
What Practitioners Are Telling Us
Programs haven’t slowed down, but they’ve gone quiet. Our 2026 State of Supplier Diversity report showed us what changed this year:
- 53% said political and regulatory change is now a top-three challenge. This is the first year it’s beaten budget as the top concern.
- 50% have pulled back on public communication about their program.
- 47% have renamed or rebranded their program.
- 76% now say the program exists for supply chain resilience, not just representation goals.
- 54% say tariffs and trade policy changed how they think about their suppliers.
- 65% still have some kind of reporting requirement, through client contracts, state rules, or federal rules.
Here’s what that adds up to: peer conversations that used to happen in the open now mostly happen one-on-one, if they happen at all. With fewer public numbers and less casual comparison, teams are quietly wondering, “What is everyone else actually doing?”
What the Benchmark Data Actually Shows
Every year, Supplier.io checks and verifies spend data across its platform. In 2025, that added up to:
| Metric | 2025 Number |
| Total spend analyzed | $3.4 trillion |
| Companies included | 500+ |
| Industries included | 15+ |
| Average spend with small & diverse businesses | 7.6% |
| Best-in-class average (top 20% of programs) | 16%+ |
Given everything that happened in 2025, you might have expected that number to move, but it didn’t. Spend with small and diverse businesses stayed almost flat from 2024 to 2025. That held true whether you looked at small businesses alone or broke it out by diversity category. As Audrey Thomas, Sr. Product Manager at Supplier.io explained, “the aggregate masks some of the story that was happening.”
But the flat number hides something. Look at the Energy, Utilities & Waste industry as one example: total spend went up from 2024 to 2025, but the number of suppliers used went down, and the overall percentage stayed the same. That points to consolidation, with companies putting more money into fewer, already trusted suppliers instead of walking away from diverse sourcing.
Spotting a shift like that takes more than tracking your own numbers. You have to compare them to your peers. Our live poll asked attendees: “Do you know where your small and inclusive spend and volume stand relative to your peers?” Here’s how they answered:
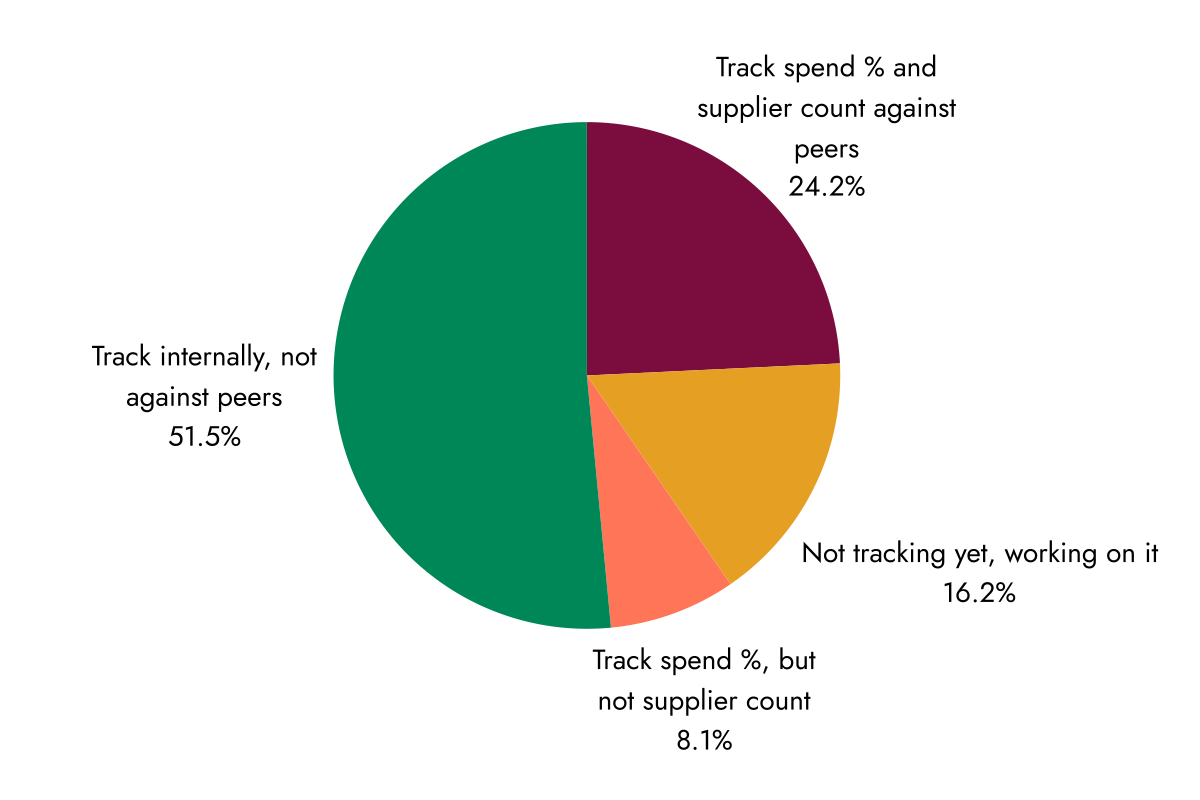
More than half of programs are only comparing themselves to their own past, not to their industry.
Why the Comparison Matters
A flat number is easy to misread as “nothing happened.” But in reality, nothing happened to the suppliers who were already earning the business. Companies that went quiet publicly didn’t necessarily cut their spend, they kept working with suppliers already proving to be reliable and cost-effective.
Carmen Bandy, Sr. Strategic Account Manager at Supplier.io, emphasized this: “The suppliers that you’ve already been working with, you are working with on purpose, with intentionality because they were suppliers that were good for your business.”
This is exactly why benchmarking matters inside a company, not just outside it. A spend number on its own doesn’t tell you if you’re ahead, behind, or right in the middle. It also doesn’t mean much to your leadership team. Benchmarking turns that number into something useful by answering two questions every leader cares about: “Are we winning more business, and are we spending more wisely?”
That’s also why finance teams, sales teams, and category managers end up caring about this data too, even when supplier inclusion isn’t their job. Reporting requirements show up in places procurement doesn’t always expect, from state-level economic programs to global rules in places like Australia, India, and the UK.
From Comparison to Action
The session ended with a live look at how practitioners can put benchmarking into action. Here’s one example: a hypothetical energy company spends $2.2 million a year on truck transportation. Only about $150,000 of that goes to small businesses, below the industry average. The benchmark highlights the gap and points straight to a list of qualified suppliers in that exact category who could help close it. “It’s not just a snapshot into how I compare against my peers, but what do I do about it,” said Thomas.
So what separated the programs that kept momentum through 2025? It wasn’t one trick. It was a repeatable process:
- Find your baseline. See where you actually stand against your peers, both overall and by category.
- Dig into the details. Find which categories or commodities are driving the gap, or the advantage.
- Plan ahead. Use what you find to guide category planning and supplier decisions before the next budget crunch forces a scramble.
- Tell it differently to different people. Show procurement the spend performance. Show finance the compliance angle. Show sales the growth opportunity.
A few live Q&A questions added more color:
- Are suppliers letting their certifications lapse? Not really. If anything, more suppliers are signing up, including ones with no existing customer relationship who just want to be found.
- How are teams handling Tier 2 reporting with new executive orders? Most are sticking close to federal categories (small, women-owned, veteran-owned) since that keeps them grounded in an existing rule rather than guessing.
- How do you present this to a CFO or CPO? Don’t show them everything, just pick one or two numbers that matter most to their job.
The bottom line: the benchmarking number by itself doesn’t tell you much. What you do with it, compared to your peers, is what counts. Bandy put it simply: “Now it’s data-driven guidance, instead of it being reactionary.”
The Supplier Inclusion Benchmarks
See the $3.4 trillion benchmark behind 2025’s supplier inclusion data, and what it reveals about where programs are really headed.
Watch now